by Calculated Risk on 4/26/2009 11:57:00 AM
Sunday, April 26, 2009
Bank Balance Sheet: Liquidity and Solvency, Part I
Note: I took some short cuts to make this simple - think of this conceptually. I'm intentionally mixing financial institutions. For commercial banks, the FDIC stopped the bank run by upping the FDIC insurance. For investment banks, the Fed provided the liquidity. Please think of this conceptually or I'll have to write 100 pages ...
This post looks at a bank balance sheet and a liquidity crisis. In a subsequent post, I'll look at a solvency crisis and two possible solutions.
A special hat tip to This American Life’s Alex Blumberg and NPR’s Adam Davidson who presents some of the same ideas (although I'm going to go further). Here is the website for their presentation. Click on graph for larger image in new window.
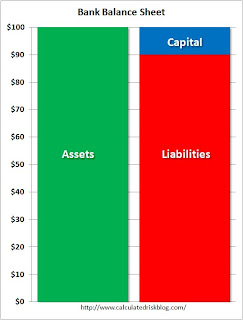
If you watch the Planet Money presentation, they explain the basics of a bank from a balance sheet perspective. It doesn't matter if the left scale is in dollars or billions of dollars - the structure is the same.
Capital is the amount of money investors put into the bank plus any retained earnings. Liabilities is the money the bank borrows from depositors or other sources. And assets are loans that the bank makes (and a little cash and other assets). (see Alex and Adam's presentation to make this clear).
The balance is: Assets = Capital + Liabilities
Banks make money by lending at a higher rate than they borrow. In the Planet Money example, the banks borrowed at 3%, loaned the money at 6%, for a spread of 3%. The difference between 6% and 3% is called the "net interest spread".
Banks report something a little different called the "net interest margin". The difference between the "spread" and the "margin" is because not all assets are loans (some might be held as cash for regulatory reasons). Net Interest Margin (NIM) is the interest earned, minus the interest paid, divided by total assets. As an example, Wells Fargo just reported a net interest margin of "approximately 4.1 percent".
Now look at how profitable a bank could be. If this bank had $100 billion in assets, and a NIM of 4.1% that would be $4.1 billion in annual profits before expenses and charge-offs - on just $10 billion in capital (Note: The diagram shows 10-to-1 leverage; many banks were levered 30-to-1 or more).
Of course the bank has expenses (all those nice buildings and employees) - and there are always charge-offs for loans that don't get repaid, even in good times. For reference, the Federal Reserve tracks the charge-offs by loan category here.
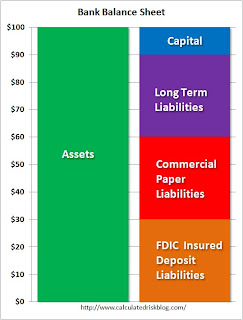
Banks have two main risks: interest rate risks and credit risks. Since banks mostly borrow short and lend long, they are exposed to increases in short term interest rates, and this would lead to lower NIMs. The credit risk is that too many of those assets will go bad (more on credit risks in the next post). Not all liabilities are the same. The second diagram shows three categories of liabilities: 1) Long term bank debt, 2) commercial paper (called CP, this is less than 270 days duration, and usually much shorter), and 3) FDIC insured deposits.
Each category has advantages and disadvantages.
Commercial paper is usually the lowest interest rate, but it is the shortest duration and has the highest interest risk. Usually the bank pays the highest interest rate on long term debt, but there is no interest risk for the duration of the security. Most banks have a mix of liabilities.
Now imagine the bank starts reporting higher than expected credit losses - or at least depositors believe the bank will start reporting huge loses.  Here the bank has lost $5 billion, and the capital has been cut in half.
Fearing further losses, the commercial paper (CP) investors run for the hills and refuse to reinvest again when their short term paper matures.
The FDIC insured depositors run (or amble) towards the hills too. A classic bank run.
The long term debt holders are stuck. They can sell in the market, but at a lower price - and that doesn't impact the bank's balance sheet (OK, there are some accounting issues here that I will ignore).
To stop the bank run, the FDIC stepped up and increased the guarantee on FDIC insured assets to $250 thousand. But this did nothing for the commercial paper investors.  Next the Fed steps in and replaces the commercial paper liability as it matures.
If this was just a panic, and the bank was actually fine, the commercial paper investors would return (or the bank could sell more long term debt), and the Fed would be replaced by private debt.
However this is not just a liquidity crisis, and the Fed is still providing liquidity to the banks.
This doesn't work long term because the Fed requires the banks to over collateralize any money borrowed from the Fed. As the long term debt starts to mature, those investors will follow the commercial paper investors to the hills - and the Fed will have to provide more and more liquidity. And eventually there will not be enough collateral to borrow from the Fed. Here is an example of the Collateral Margins Table for the discount window.
Next I'll discuss the solvency issues (not as easy to fix).


